How Much Does a Wedding Cost in the UK? The 2026 Average is £20,604


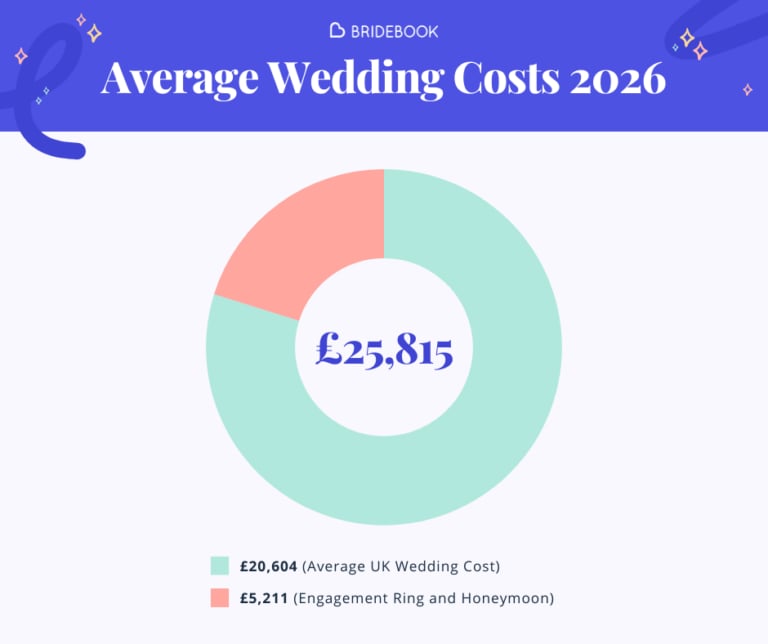
Wondering how much the average wedding costs in the UK? According to Bridebook’s 2026 UK Wedding Report, the average wedding cost in the UK is £20,604.
That figure covers the wedding day itself – venue, catering, photography, outfits, flowers and entertainment. It does not include the honeymoon or engagement ring, which are usually budgeted for separately. The typical wedding budget in the UK falls somewhere between £10,000 and £30,000, though a quarter of couples spend £10,000 or less.
Bridebook surveyed 7,000 newly married and actively planning couples for our 2026 report, making this one of the largest wedding cost datasets in the UK.
So whether you’re building your wedding budget from scratch or comparing your plans against the national average, this guide breaks down what UK couples are really spending in 2026.
TL;DR: Average Wedding Cost in the UK
The average UK wedding cost is £20,604 in 2026.
Here’s the quick answer:
- Average UK wedding cost: £20,604
- Average cost per guest: £278
- Biggest wedding expenses: venue, catering, photography and attire
- Cheapest ways to get married: smaller guest lists, weekday dates and registry office ceremonies
- Most expensive region: London
- Cheapest months to marry: January, February and October
- Typical wedding budget range: £10,000–£30,000
Average wedding cost in the UK: £20,604Most couples spend less or more than this depending on guest count, location, venue and supplier choices.
Source: Bridebook’s UK Wedding Report 2026, based on a survey of 7,000 UK couples.
Average Wedding Cost in the UK in 2026
The average cost of a wedding in the UK in 2026 is £20,604, according to Bridebook’s latest data.
That makes the average wedding budget broadly stable year on year. In 2025, the average was £20,822, and in 2024 it was £20,775. In other words, couples are not necessarily spending less on weddings – they’re just spending more intentionally.
This typical £20,000 wedding budget is spread across a range of core elements, with the venue, catering and guest experience accounting for the largest share of spend.
To put that number into context:
| Wedding Type | Typical Cost |
|---|---|
| Budget wedding | £5,000–£10,000 |
| Average UK wedding | £20,604 |
| Luxury wedding | £30,000+ |
Wedding costs vary hugely depending on:
- where you get married
- how many guests you invite
- whether you choose a venue with in-house catering
- how much you spend on suppliers like photography, fashion and entertainment
For many couples, the national average is best used as a benchmark rather than a target.
Discover the most affordable wedding venues in the UK here.
Wedding Cost Breakdown: What UK Couples Spend Money On
If the average UK wedding costs £20,604, where does that budget actually go?
Bridebook’s 2026 data shows that the largest share of spend still goes towards the venue and catering, followed by wedding attire, photography and videography, and decor and entertainment.
Average wedding budget split
| Category | Share of Budget |
|---|---|
| Venue hire and catering | 51% |
| Wedding attire | 19% |
| Photography and videography | 10% |
| Flowers and décor | 7% |
| Entertainment | 7% |
| Other suppliers and extras | 6% |
That means over half of the average wedding budget is spent on the venue and food alone.
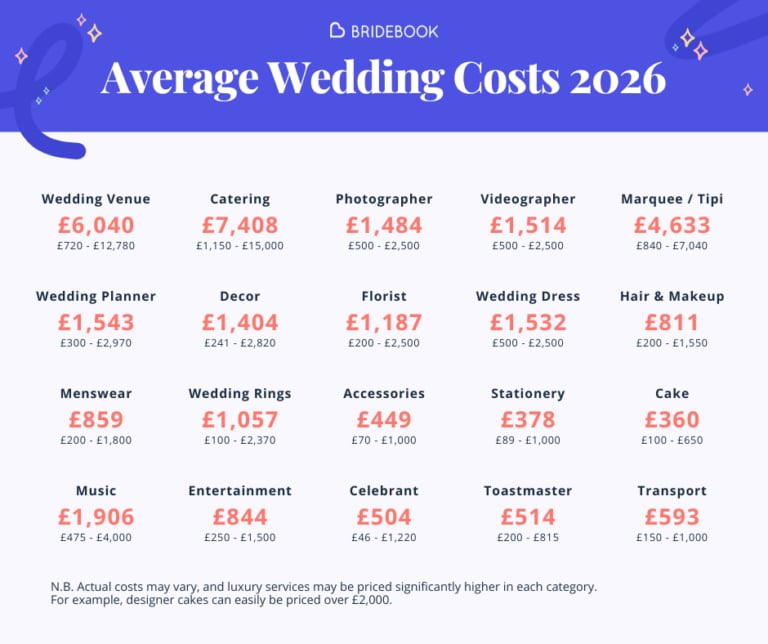
Average wedding supplier costs in 2026
| Category | Average Spend |
|---|---|
| Venue (excluding catering) | £6,040 |
| Catering – reception | £5,406 |
| Catering – evening | £2,002 |
| Marquee / tipi | £4,633 |
| Wedding planner | £1,543 |
| Dress | £1,532 |
| Videographer | £1,514 |
| Photographer | £1,484 |
| Decor | £1,404 |
| Florist | £1,187 |
| Music – reception | £1,061 |
| Rings / jewellery | £1,057 |
| Menswear | £859 |
| Music – ceremony | £845 |
| Entertainment | £844 |
| Transport | £593 |
| Toastmaster | £514 |
| Celebrant | £504 |
| Accessories | £449 |
| Hair styling | £417 |
| Make-up | £394 |
| Stationery | £378 |
| Cake | £360 |
These numbers reflect a broad range of weddings across the UK, from low-key celebrations with friends and family providing services, to premium supplier-led days. They also show that while couples are making savings in some areas, they still tend to prioritise suppliers that shape the overall guest experience.
Biggest Wedding Expenses in the UK
For most couples, the most expensive parts of a wedding are still the venue and catering.
Venue
The venue remains the single biggest wedding expense. In 2026, the average cost of a venue excluding catering is £6,040. Premium venues, exclusive-use properties and popular weekend dates can push this much higher.
Catering
Reception catering costs £5,406 on average, with evening food adding another £2,002. Rising food, energy and staffing costs mean catering remains one of the clearest drivers of overall wedding spend.
Photography and videography
Couples continue to prioritise capturing the day professionally. The average spend is £1,484 for photography and £1,514 for videography.
Attire
Wedding fashion is another major category, with the average dress costing £1,532 and menswear averaging £859, before accessories.
Entertainment
From ceremony musicians to bands, DJs and other entertainment, couples spend a meaningful portion of their budget here too. Reception music averages £1,061, ceremony music £845, and other entertainment £844.
How Wedding Costs Change by Guest Count
Guest count is one of the biggest factors affecting wedding spend.
The more people you invite, the more you usually spend on:
- food and drink
- tables and furniture
- stationery
- venue size
- favours
- transport
- overall logistics
Bridebook’s 2026 data shows clear differences in total spend depending on wedding size.
| Guest Count | Estimated Cost |
|---|---|
| 50 guests | £15,162 |
| 70 guests | £21,791 |
| 100 guests | £22,510 |
| 120+ guests | £26,000 |
This is why cutting the guest list is often the fastest way to reduce your wedding budget.
Smaller weddings also give couples more flexibility to spend more per guest on the things they care most about — whether that’s better food, upgraded drinks, a dream photographer or a more luxurious setting.
Wedding size categories
As a general guide:
- Micro wedding: fewer than 50 guests
- Small wedding: around 50–70 guests
- Medium wedding: around 71–100 guests
- Large wedding: more than 100 guests
Average Cost Per Wedding Guest in the UK
The average cost per wedding guest in the UK is around £278 in 2026.
But the cost per guest changes depending on wedding size. Smaller weddings often cost more per head, because couples tend to invest more in each guest’s experience.
| Wedding Size (Day Guests) | Total Average Spend | Average Cost per Guest |
|---|---|---|
| 50 guests | £15,162 | £303 |
| 70 guests | £21,791 | £311 |
| 100 guests | £22,510 | £225 |
| 120+ guests | £26,000 | £217 |
This reflects a major planning trend: couples are increasingly choosing smaller, more intentional celebrations.
In 2026:
- 41% of wedding receptions host fewer than 60 guests
- the average ceremony has around 74 guests
- evening guest numbers have fallen sharply compared with previous years
So while total budgets have remained fairly stable, guest lists have got leaner.
Cheap Wedding Options in the UK
Not every wedding needs to cost £20,000.
If you’re planning on a tighter budget, there are lots of ways to reduce costs without losing what makes the day special. In fact, 25% of couples spend £10,000 or less on their wedding.
The cheapest ways to get married in the UK include:
- having a registry office wedding
- choosing a weekday or off-peak date
- keeping your guest list small
- hosting your reception in a pub, restaurant or non-traditional venue
- using DIY décor, stationery or flowers
- prioritising only the suppliers that matter most to you
Registry office weddings are usually the most affordable legal option, and many couples combine a simple ceremony with a smaller celebration afterwards.
You can also read our guide to registry office wedding costs if you’re comparing options.
Can you have a wedding for £5,000 in the UK?
Yes – but it usually requires compromises.
A £5,000 wedding is most achievable if you:
- invite fewer guests
- choose a simple or non-traditional venue
- avoid peak summer Saturdays
- skip extras that don’t matter to you
- ask friends and family to help with certain elements
How Wedding Costs Have Changed Over Time
One of the most interesting findings in Bridebook’s 2026 data is that average wedding costs have stabilised.
| Year | Average Wedding Cost | Source |
|---|---|---|
| 2026 | £20,604 | Bridebook (~7,000 couples) |
| 2025 | £20,822 | Bridebook (~7,000 couples) |
| 2024 | £20,775 | Bridebook (~6,000 couples) |
| 2023 | £19,184 | Bridebook |
| 2022 | £16,529 | Bridebook |
Source: Bridebook UK Wedding Report, annual surveys of married and engaged couples. Figures exclude engagement ring and honeymoon.
Wedding costs peaked during the post-pandemic bounce – couples who had postponed celebrations returned to the market with pent-up demand and larger guest lists, pushing average spend up sharply in 2022 and 2023.
Since then, the market has stabilised. The average has remained close to £20,000 for three consecutive years, reflecting a shift towards more intentional budgeting rather than any broader retreat from spending on weddings.
That does not mean weddings have become cheap. It means couples are getting smarter about how they spend. Instead of increasing budgets endlessly, many are:
- reducing guest numbers
- choosing midweek weddings
- rethinking traditions
- spending more selectively on priority suppliers
So the story in 2026 is less about cutting back and more about spending smarter.
Average Wedding Cost by Region in the UK
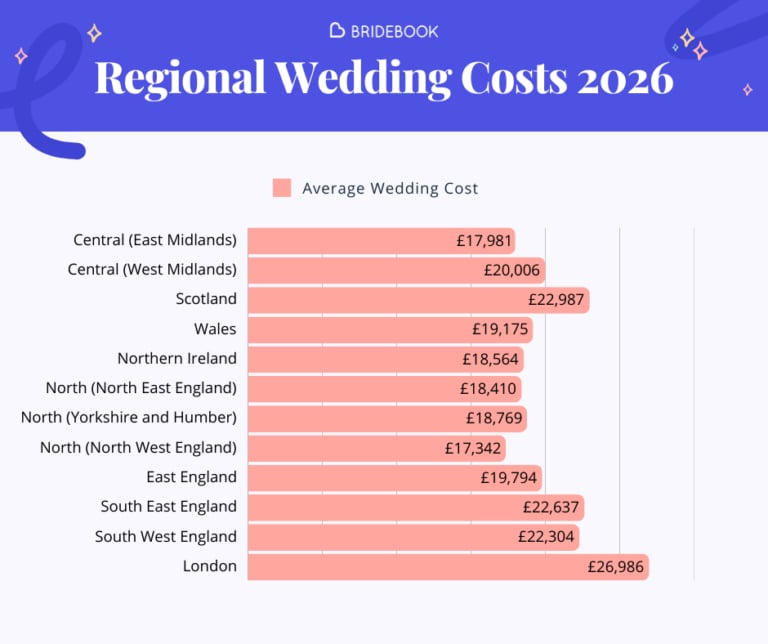
Where you get married can have a major impact on your overall spend.
Bridebook’s 2026 data shows a clear regional spread, with London remaining the most expensive place to get married.
| Region | Average Spend |
|---|---|
| London | £26,986 |
| Scotland | £22,987 |
| South East England | £22,637 |
| South West England | £22,304 |
| Central (West Midlands) | £20,006 |
| East England | £19,794 |
| Wales | £19,175 |
| North (Yorkshire and Humber) | £18,769 |
| Northern Ireland | £18,564 |
| North (North East England) | £18,410 |
| Central (East Midlands) | £17,981 |
| North (North West England) | £17,342 |
It is not just the total cost that varies – supplier prices themselves differ significantly by region.
Bridebook’s data shows that wedding suppliers in London typically charge around 30% above the national average, while couples marrying in Yorkshire and the Humber benefit from supplier costs that run about 12% below the national average.
Discover more on the average cost of a London wedding here, or read up on how much a wedding costs in Scotland.
Average supplier cost variation by region
| Region | Supplier Cost vs UK Average |
|---|---|
| London | +30% |
| Northern Ireland | +13% |
| Scotland | +7% |
| North East England | +5% |
| East of England | +4% |
| South East England | +1% |
| South West England | -1% |
| North West England | -2% |
| West Midlands | -4% |
| Wales | -5% |
| East Midlands | -9% |
| Yorkshire & the Humber | -12% |
Source: Bridebook 2026 UK Wedding Report. Figures are indicative averages across supplier categories.
These differences compound: a couple marrying in London will typically pay more for the venue, more for the photographer, more for the florist – across the board. Choosing a region with lower supplier costs can therefore make a meaningful difference to your overall budget.
Most expensive places to get married in the UK
| Region | Average Cost | vs UK Average |
|---|---|---|
| London | £26,986 | +31% |
| Scotland | £22,987 | +11% |
| South East | £22,637 | +10% |
| South West | £22,304 | +8% |
London is still by far the most expensive region, largely because of venue, catering and supplier costs. But it’s not only the South that commands higher prices – Scotland is also notably above the UK average.
If you’re comparing locations, these regional differences can have a major impact on what your budget will realistically buy.
Cheapest and Most Expensive Months to Get Married
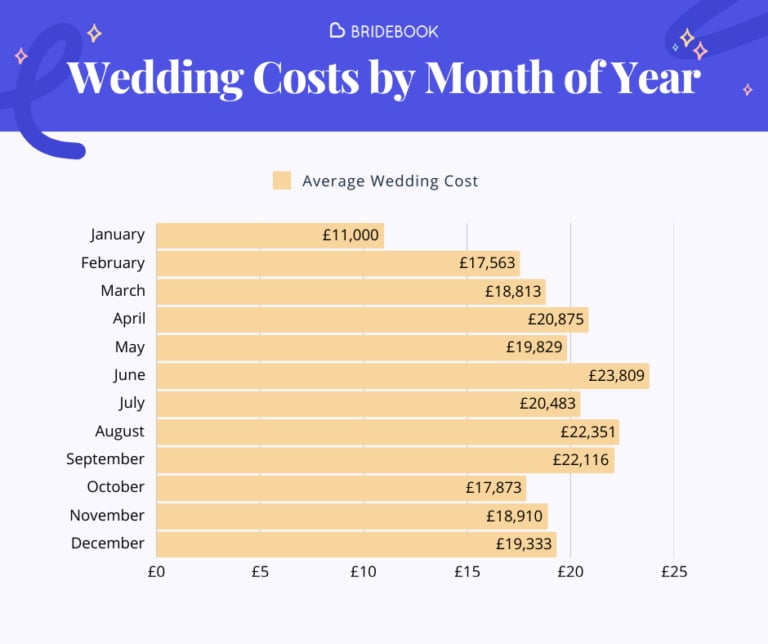
Wedding date can be just as important as location when it comes to cost.
Bridebook’s 2026 data shows that seasonality still plays a big role in wedding pricing, with summer weddings generally costing more and winter weddings often offering better value.
| Month | Average Spend |
|---|---|
| January | £11,000 |
| February | £17,563 |
| March | £18,813 |
| April | £20,875 |
| May | £19,829 |
| June | £23,809 |
| July | £20,483 |
| August | £22,351 |
| September | £22,116 |
| October | £17,873 |
| November | £18,910 |
| December | £19,333 |
Most expensive months
- June
- August
- September
Cheapest months
- January
- February
- October
Weekday weddings are also becoming more popular. Fewer than half of weddings now take place on a Saturday, with Wednesday and Thursday weddings growing in popularity – especially among younger couples looking for better value.
If you’re trying to save money, switching from a peak Saturday in summer to an off-peak weekday can make a significant difference to venue and catering costs.
Ways to Reduce Wedding Costs Without Sacrificing the Day
The good news is that couples have more options than ever to keep costs under control without feeling like they’re settling.
Here are some of the most effective ways to reduce your wedding costs in the UK:
1. Choose an off-peak date
Winter weddings and weekday celebrations are often much cheaper than peak summer Saturdays.
2. Cut your guest list
A smaller guest list reduces food, drink, furniture, stationery and venue costs all at once.
3. Prioritise your must-haves
Decide which elements matter most to you, then allocate more of your budget there and spend less elsewhere.
4. Compare venues carefully
Venue choice shapes a huge chunk of the budget, so it’s worth comparing what’s included before booking.
5. Consider non-traditional venues
Restaurants, pubs and flexible event spaces can offer better value than dedicated wedding venues.
6. DIY strategically
DIY can save money on things like stationery, signage and favours, but it’s not always cheaper for everything.
7. Rethink traditions
You do not need every wedding extra if it doesn’t feel important to you. Many couples are happily skipping traditions that don’t add real value.
Are Couples Spending Less – or Spending Smarter?
Wedding budgets haven’t collapsed, they’ve just become more intentional.
Bridebook’s 2026 data suggests couples are increasingly focused on value. Rather than cutting every area of spending, they’re making more targeted choices, such as:
- reducing guest numbers
- choosing midweek or off-peak dates
- replacing traditions with more personal alternatives
- prioritising venue, catering and photography over less important extras
This is especially true for Gen Z couples, who are generally spending less than Millennials but are often more willing to question wedding conventions and build a day that reflects their own priorities.
Wedding spend bands in 2026
| Spend Level | % of Couples |
|---|---|
| £10,000 or under | 25% |
| £10,001–£25,999 | 40% |
| £26,000+ | 25% |
| £35,000+ | 10% |
So while the average wedding cost is just over £20,000, there is no single “normal” budget. The UK market now spans everything from simple £5,000 celebrations to £35,000-plus weddings.
How Wedding Costs Vary by Generation
Wedding spend varies significantly depending on the couple’s age group, according to Bridebook’s 2026 data.
Gen Z wedding couples (born 1997 or later) tend to spend less overall, with an average wedding cost of around £19,095 – roughly £1,700 below the national average. They are also more likely to spend under £10,000, with around 30% choosing to keep costs below that threshold.
That does not mean Gen Z couples are settling for less. Many are actively choosing to spend differently – prioritising photography and experience over tradition, opting for smaller guest lists, and rethinking conventions that do not feel relevant to them. Around 22% of Gen Z couples still spend over £25,000, showing the range within this group is wide.
The generational picture in 2026 is less about a spending divide and more about different priorities. Gen Z couples are not cutting budgets out of necessity – many are making deliberate choices about what a wedding should look like.
Average wedding spend: Gen Z vs national average
| Average Spend | |
|---|---|
| Gen Z couples | ~£19,095 |
| UK average (all couples) | £20,604 |
| Top 25% of all couples | £27,000+ |
Source: Bridebook 2026 UK Wedding Report.
Wedding Cost FAQs
How much does the average wedding cost in the UK?
The average wedding cost in the UK is £20,604 in 2026, according to Bridebook’s latest data. This covers the wedding day itself and excludes the honeymoon and engagement ring.
What is the biggest wedding expense?
For most couples, the venue and catering are the biggest wedding expenses. Together, they account for more than half of the average wedding budget.
What is the cheapest way to get married in the UK?
A registry office wedding is usually the cheapest legal way to get married in the UK. Costs can be reduced further by choosing a weekday, inviting fewer guests and having a small reception afterwards.
Can you have a wedding for £5,000 in the UK?
Yes. Smaller weddings, off-peak dates, simpler venues and selective supplier choices can make a £5,000 wedding possible.
How much does a wedding cost per guest?
The average cost per wedding guest is around £278 in 2026, although smaller weddings often work out at a higher per-head cost.
Has the average cost of a wedding gone up?
Not significantly. The average wedding cost was £20,822 in 2025 and £20,604 in 2026, suggesting overall spend has stayed broadly stable.
Which part of the UK is most expensive to get married in?
London is the most expensive place to get married in the UK, with an average wedding cost of £26,986.
Which months are cheapest for weddings?
January, February and October are the cheapest months on average, while June, August and September are the most expensive.
What is a typical wedding budget in the UK?
A typical wedding budget in the UK falls between £10,000 and £30,000. The national average is £20,604, but around a quarter of couples spend £10,000 or less, and around a quarter spend more than £26,000. The range is wide because guest count, location and venue choice have such a large impact on total cost.
Wedding Costs in 2026
The average cost of a wedding in the UK is £20,604 in 2026, but that number should be treated as a guide, not a rule.
Some couples will spend far less. Others will spend much more. What matters most is understanding the biggest cost drivers – especially guest count, venue, catering, location and date – so you can build a budget that works for you.
Whether you’re planning a £5,000 pub wedding or a £30,000 country house celebration, the smartest budgets are the ones that reflect your priorities.
Ready to start planning? Bridebook can help you build your budget, manage your guest list and find the right venue and suppliers for your day – discover our wedding planning tools here.
The Average Cost of a Wedding in 2025 Was £20,822
In 2025, the average cost of a wedding in the UK was £20,822, rising to £26,583 when including the engagement ring and honeymoon.
The data, collected from around 7,000 couples, revealed key differences in spending patterns:
- Gen Z couples tended to spend less overall (£19,095 on average) and were more likely to spend under £10,000 than non-Gen Z couples
- Around a quarter of couples spent less than £10,000, while the top 10% spent over £38,000, showing a widening range of wedding budgets
- Average supplier costs showed that venue and catering were the biggest portion of wedding spend, with the average venue (including catering) costing about £9,811, far more than other categories like photography or videography
2025 UK Wedding Costs by Category
- Venue hire (including catering) – £9,811 / (venue only) – £5,945
- Catering (reception) – £5,395 / (evening) – £1,840
- Photography – £1,482
- Videography – £1,386
- Flowers – £1,132
- Wedding cake – £365
- Wedding dress – £1,515
- Wedding menswear – £845
- Fashion & accessories – £379
- Wedding rings & jewellery – £955
- Hairdressing – £358
- Makeup – £363
- Music (ceremony) – £821 / (reception) – £1,102
- Entertainment (non-music) – £704
- Wedding stationery – £413
- Decor & hire – £1,271
- Marquee / tipi – £4,532
- Transport – £626
- Wedding favours – £158
- Wedding planner – £1,892
- Celebrant – £546 / Toastmaster – £477
- Engagement ring – £2,158
- Honeymoon – £4,608
Source: Bridebook’s UK Wedding Report 2025, based on a survey of 7,000 UK couples.
The Average Cost of a Wedding in 2024 Was £20,775
In 2024, the average cost of a wedding in the UK was £20,775, rising to £25,952 when including the engagement ring and honeymoon.
The data, collected from around 6,000 couples, revealed key differences in spending patterns:
- Gen Z couples were more affected by economic pressures but still expected to spend more than previous generations, often investing an extra £4,000 on their weddings while finding creative ways to save, such as upcycling decor or reselling items
- Around a quarter of couples spent less than £10,000, while the top 10% spent over £38,000, showing a wide range of wedding budgets
- Guest count had a major impact on costs, with couples hosting 50 guests or fewer spending around £12,006, while those with 150+ guests spent £37,431 on average
2024 UK Wedding Costs by Category
- Venue hire (including catering) – £9,877 / (venue only) – £6,084
- Catering (reception) – £5,732 / (speciality) – £1,097
- Photography – £1,464
- Videography – £1,439
- Flowers – £1,182
- Wedding cake – £405
- Wedding dress – £1,309
- Wedding menswear – £764
- Fashion & accessories – £285
- Wedding rings & jewellery – £2,089 (engagement ring) / £1,021 (other jewellery)
- Hairdressing – £358
- Makeup – £328
- Music (ceremony) – £641 / (reception) – £1,127
- Entertainment (non-music) – £727
- Wedding stationery – £384
- Decor & hire – £1,449
- Marquee / tipi – £4,202
- Transport – £705
- Wedding favours – £158
- Wedding planner – £2,436
- Celebrant – £501 / Toastmaster – £515
- Honeymoon – £4,329
Source: Bridebook’s UK Wedding Report 2024, based on a survey of 6,000 UK couples.
You Might Also Like…
- The Ultimate Wedding Budget Breakdown
- Introduction: Your Wedding Budget
- How to Save Money on Your Wedding: The Ultimate Cost-Cutting Guide
- Hidden Wedding Costs Every Couple Needs To Know About
- How to Ask Your Parents for Wedding Money
Related articles