The UK Regions With Civil Ceremony Strongholds

Where Civil Ceremonies Are Booming in the UK
If you were going to tie the knot soon, what kind of ceremony would you have? Across the country, couples are moving away from traditional weddings.
Why? For some, it’s all about affordability. For others, it’s a move towards ceremonies that make more sense in an increasingly secular society.
Of course, wedding trends play a big role here, too. Smaller, more intimate weddings are in vogue, and weekday weddings aren’t the faux pas they used to be (it is your day, after all). Civil celebrity weddings, like Charli XCX and The 1975’s George Daniel, have only fuelled this trend. Online, Gen Z also seems fully onboard; Pinterest searches for ‘registry office wedding dress’ have surged by 162% over the past year!
There’s no question about it; the civil ceremony is here to stay. But where, exactly, are civil ceremonies taking hold?
Tie the Knot Your Way: Religious Ceremonies vs Civil Ceremonies
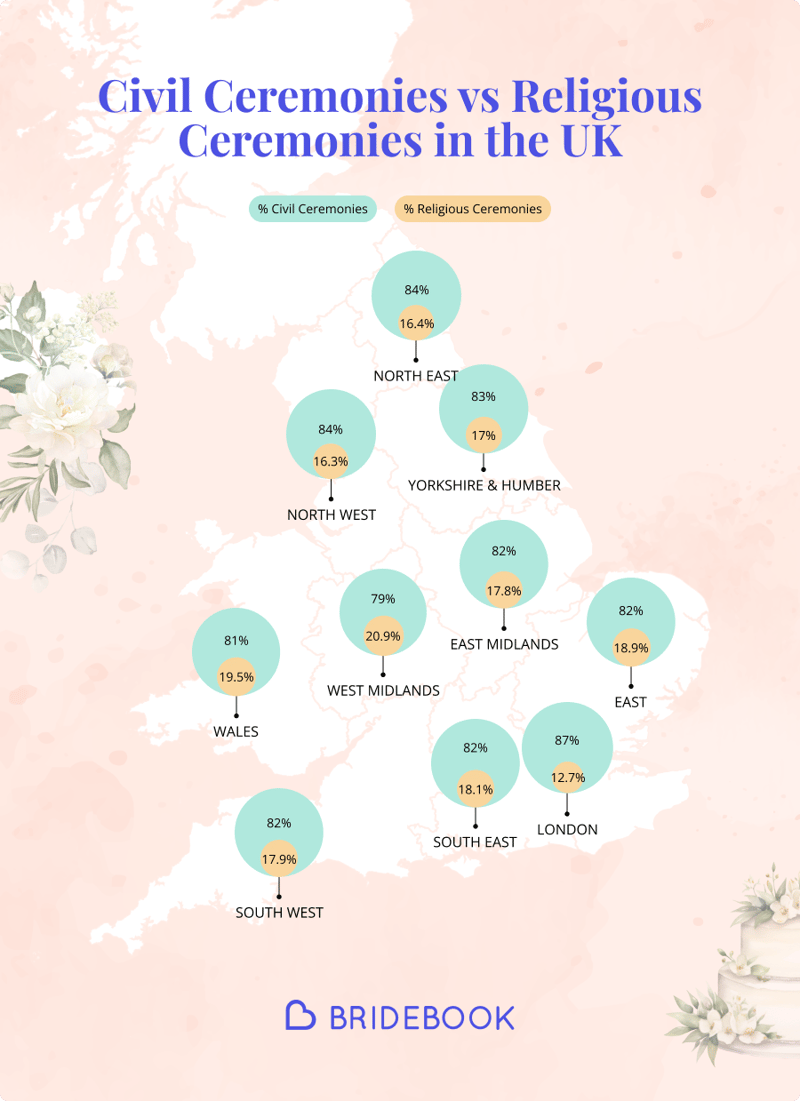
Civil ceremonies now make up 83% of UK weddings, new ONS data reveals – with a striking 197,273 against just 41,824 religious marriages. That’s right, civil ceremonies may be fresh to your social media feeds, but they have been the wedding majority for quite some time.
It shouldn’t be surprising to learn that London leads when it comes to civil ceremonies. There, 87% of weddings are civil ceremonies, more than any other region. From that, you might assume that the whole South – home to densely populated cities and liberal social trends – would lead in the number of civil ceremonies, but not so fast!
By region, the North West (84%), North East (84%), and Yorkshire & Humber (83%) lead in civil ceremonies. Religious ceremonies have a slightly stronger presence in the South, with the South East and South West following closely behind, with 82% of weddings being civil ceremonies.
So, where were religious ceremonies more common? Look to the West Midlands for that, with 21% of ceremonies classified as religious. Behind them, the East and Wales were tied at 19%.
Even still, the lion’s share of weddings in these regions – all regions – were civil in nature. This suggests that while faith-based ceremonies continue to play a role, civil ceremonies are booming!
How Are Couples Across the UK Shaking Up Tradition?
If we had to name the single biggest way couples are breaking new ground, it would be through their wedding venues. More venue options have opened up to marrying couples, especially now that outdoor ceremonies are legal and popular with young couples in England and Wales. No longer are churches or town halls required – now stately homes, hotels, and gardens are an option. Likewise, the order of the ceremony has become more lax, resulting in different wedding ceremony orders to fit all lifestyles.
London’s Boroughs Leading the Civil Ceremonies Boom
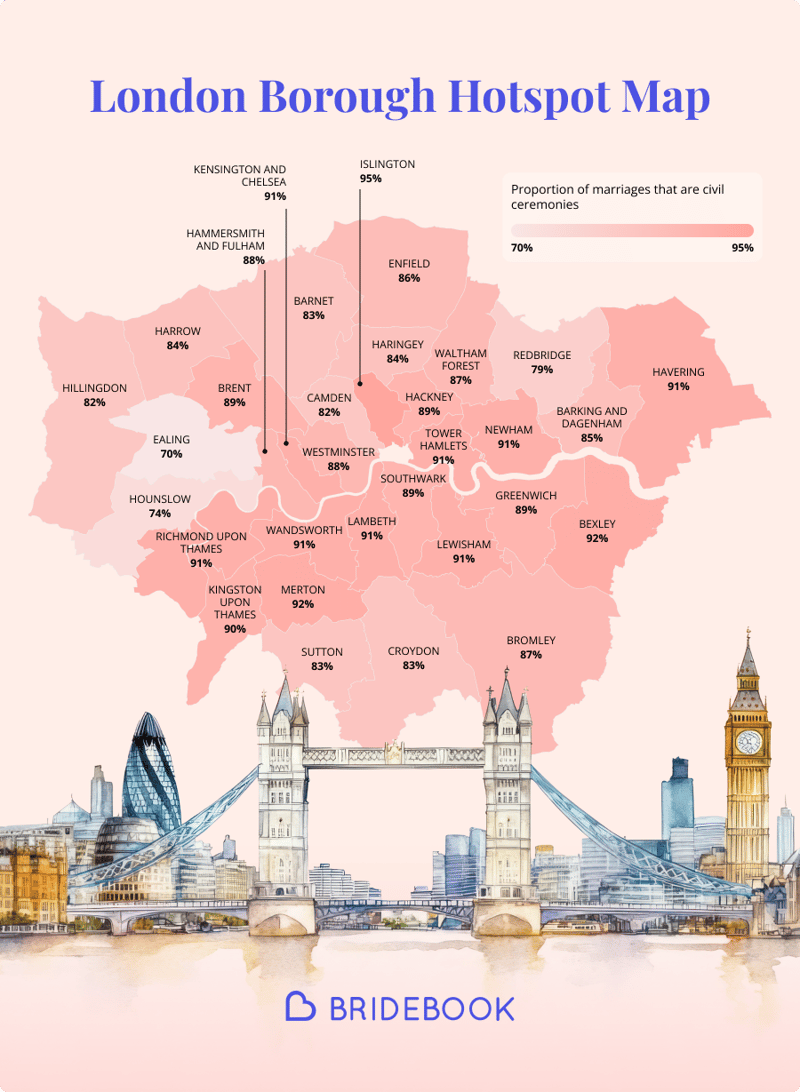
So, London is at the heart of the civil ceremony boom, but we can go deeper than that. Not all boroughs are equal – for every Islington (95%), there’s an Ealing (70%). What does this disparity tell us? Well, there could be a few answers…
The three biggest civil ceremony boroughs are Islington, Merton (92%), and Bexley (also 92%). The lowest? Ealing, then Hounslow (74%) and Redbridge (79%). At a glance, there’s no pattern for why these boroughs choose different wedding venues in London. Both Bexley and Redbridge are outer boroughs, for example, yet they’re 13 percentage points apart!
If location isn’t the driver here, what is?
First, Hounslow and Redbridge are some of the most diverse boroughs in the city. Ealing fits too, especially in its southwestern postcodes, where a rich blend of backgrounds helps shape the character of the area. As the country becomes more diverse, we may see more religious weddings from residents practicing Islam, Hinduism, Sikhism, and other faiths. Diversity could even reverse civil ceremony trends in some areas, as they become more religious.
Second, culture is more influential than having a heavy wallet. Ealing leads in religious weddings despite being economically stronger than Hounslow and Redbridge, so money isn’t everything when couples choose to tie the knot.
Where Love’s Breaking the Mould Outside of London
We can find more marriage insights away from London’s bustling streets.
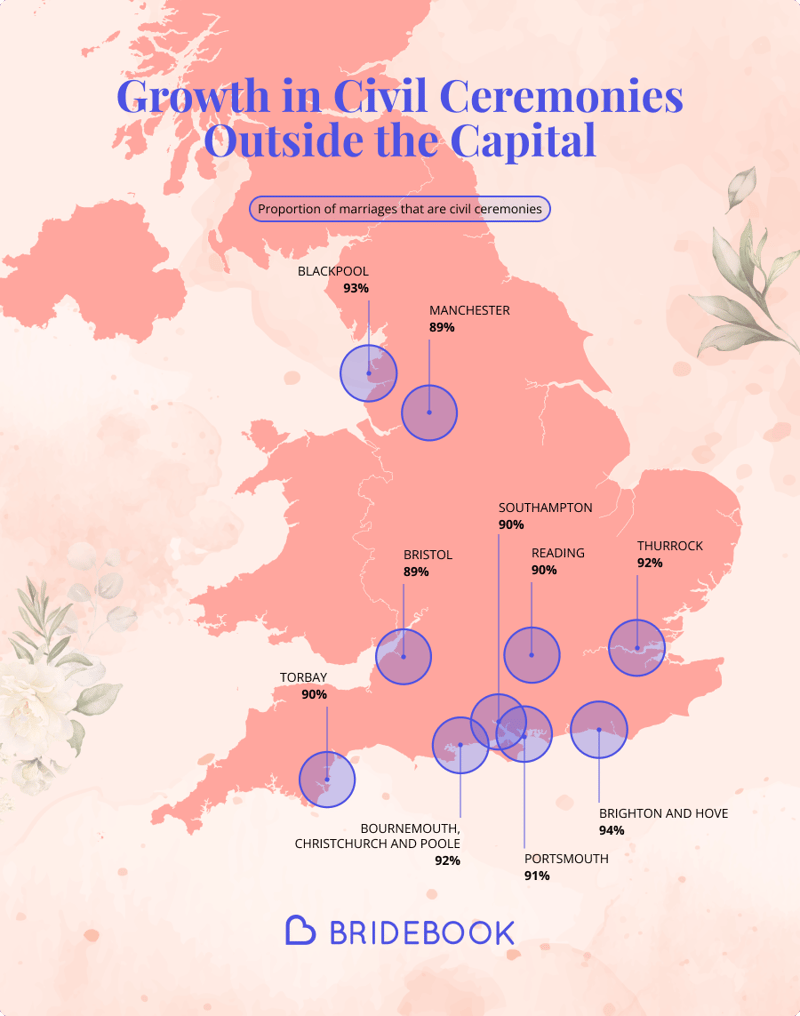
As always, the South posts unique wedding statistics in the UK – fewer civil ceremonies by percentage, but most weddings take place there. Densely populated, liberal areas like Brighton and Hove lead with 94% civil weddings – a whopping 1,027 of 1,094 ceremonies! Thurrock and the BCP area follow close behind at 92%.
More trend breakers can be found in the North and the West. Blackpool has 466 of 500 (93%) civil weddings, putting it in the top three outside London. Manchester and the City of Bristol are neck and neck at 89% civil ceremonies, too. Of the two, Bristol actually had fewer weddings but more civil ceremonies, reversing the usual North-South trends.
While notable, these are exceptions to one surprising rule: the North has overtaken the South for overall percentage of civil ceremonies. Civil ceremonies have become our favourite way to get hitched, especially for Gen Z. Why? Secularism, money-saving, and venue freedom (now that outdoor wedding venues are available). When these combine, young couples flock to personal civil ceremonies over religious weddings.
Methodology
This analysis draws on the most recent and comprehensive UK marriage data available from the Office for National Statistics (ONS), covering the year 2022. We examined the total number of marriages, breaking them down by type, such as civil and religious ceremonies, to identify national trends and confirm the continued growth of civil marriages in the UK.
You Might Also Like…
- Non-Denominational Wedding Ceremony Guide
- Catholic Wedding Ceremony guide
- How Much Does a Wedding Cost? The 2025 UK Average
- The Ultimate Wedding Budget Breakdown
Happy Planning!
Related articles